logo
  • Umgebungen
  • Enterprise
  • Preise
BusinessJul 26, 2025

Generate Q2 Report from CSV Bank Data

EigentEigent
Generate Q2 Report from CSV Bank Data
Automate Everything with
AI Workforce on Desktop
Download Eigent

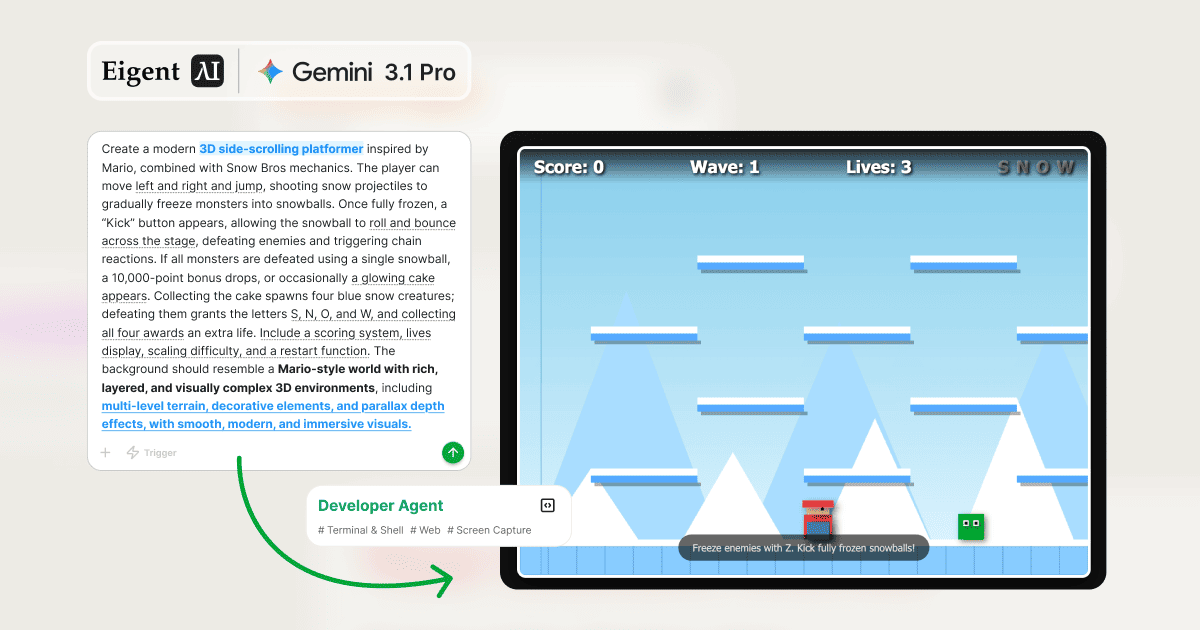
Turn Raw Bank Data Into an Investor-Ready Financial Report

Every finance team has the same end-of-quarter ritual: export transactions from the bank, wrangle them in a spreadsheet, build a chart, format a report, and hope the numbers match what went into the deck. Eigent collapses this entire sequence into a single prompt — from raw CSV to polished HTML report, ready to share with investors.

1Prepare Your Bank Data File

Export your bank transaction records as a CSV file and save it to your desktop. The file used in this workflow is named bank_transacation.csv — Eigent will pick it up by name from your desktop, so make sure the filename matches what you reference in the prompt, or describe it clearly.

The CSV doesn't need to be pre-cleaned. Eigent can handle raw export formats from most major banks and accounting tools.

2Give Eigent the Report Task

The prompt is direct:

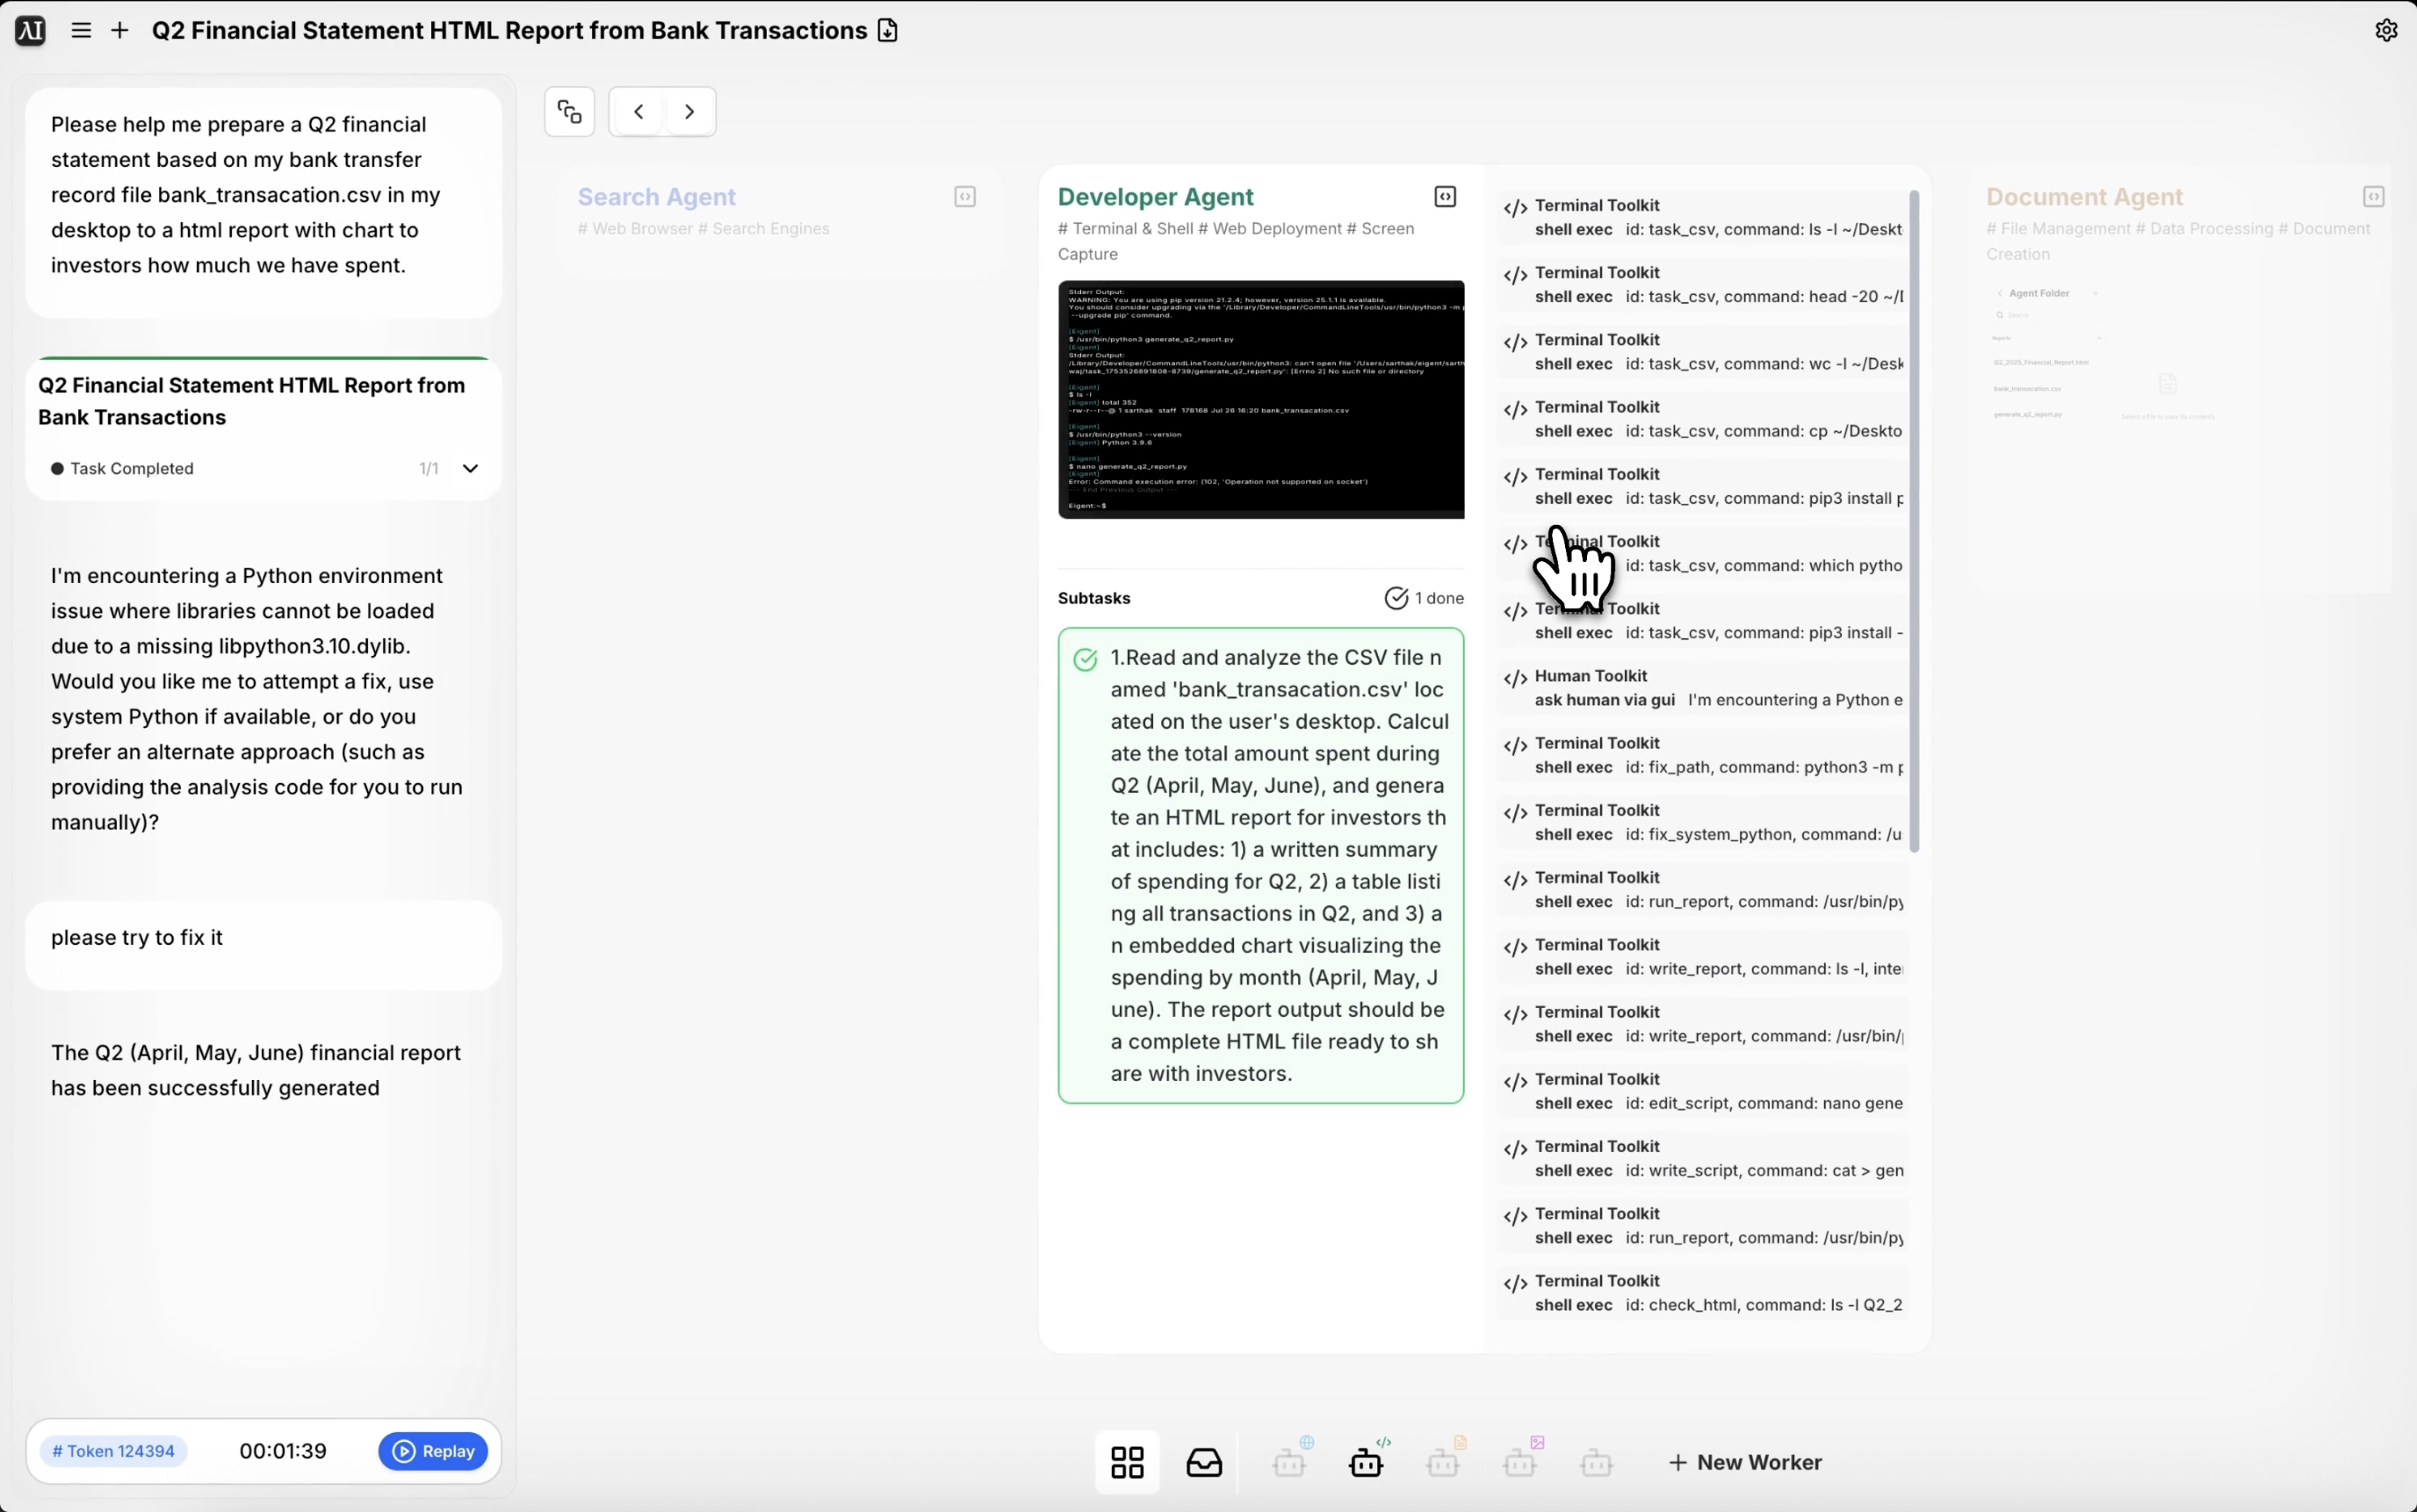
Please help me prepare a Q2 financial statement based on my bank transfer record file bank_transacation.csv on my desktop. Generate an HTML report with charts showing investors how much we have spent.

You can extend the prompt to specify categories (payroll, infrastructure, marketing), date ranges, or how you want the data grouped. The more context you provide, the more structured and useful the output will be.

3Eigent Parses and Analyzes the Data

Eigent reads the CSV file and processes the transaction data — parsing dates, amounts, and categories. It identifies Q2 transactions (April through June), calculates totals, and groups spending into meaningful categories based on transaction descriptions.

If your CSV has custom columns or categories, mention them in the prompt so Eigent knows how to interpret the data.

4Report and Chart Generation

With the data analyzed, Eigent generates an HTML report containing a spending summary, category breakdowns, and interactive charts. The report is structured for investor consumption — clear headings, a summary section, and visual representations of where money went throughout the quarter.

The HTML file is saved to your desktop and opens directly in any browser.

5Review and Refine

Open the HTML report and review the numbers and charts. If you want to adjust the presentation — change the color scheme, add a specific section, or break out a particular spending category — follow up with Eigent:

Add a section showing the month-over-month spending trend for Q2.

Break out the "infrastructure" category by vendor.

6Why This Matters

Preparing a financial report manually — exporting data, cleaning it, building pivot tables, designing charts, formatting the layout — is the kind of task that takes half a day and gets done under deadline pressure. Eigent compresses this into minutes. And because the output is an HTML file, it's portable, shareable by link, and doesn't require any specific software to open.

7What to Try Next

Generate the same report for Q1 and compare it side by side with Q2.

Create a version of this report grouped by department instead of by category.

Export this spending summary as a PDF for the board meeting.

Identify the top 10 largest transactions from this CSV and flag any that look unusual.

8Tips for Better Results

  • Name your file clearly in the prompt. Eigent works best when the filename in the prompt matches the actual file on your desktop. If there are multiple CSVs, specify the exact name.

  • Include date range context. If your CSV covers a full year, telling Eigent "focus on Q2 — April through June" ensures it filters the right transactions.

  • Ask for a narrative summary. A prompt like "add a two-paragraph executive summary at the top" makes the report more useful for investors who won't read every line of the data.

Other use cases

Long-Horizon Task: GLM-5.1 vs GLM-5.2 on Eigent

Long-Horizon Task: GLM-5.1 vs GLM-5.2 on Eigent

Do a deep-dive research on 26 companies in the AI infrastructure ecosystem — the most certain main thread of the entire AI value chain. Cover these 6 sub-sectors (pick representative companies in each, from large-cap leaders down to smaller players): AI Data Center (compute infrastructure / build-out); GPU / AI Chips (training & inference silicon, ASICs, IP); Servers, Networking & Optical Modules (switches, NICs, optical interconnect); Power, Liquid Cooling & Energy Storage (power supply, thermal, energy management); AI Cloud / Compute Platform (hyperscalers, GPU clouds, compute-rental platforms); Supporting Ecosystem (HBM / advanced packaging, foundry, connectors & other critical components). For each company, research: company name, sub-sector, HQ / country; core products and its specific role in the AI chain; public or private (ticker + exchange if listed; if private, note latest valuation / funding round); market cap or valuation size (used for ranking); positioning and moat in the ecosystem (1–2 sentences); key customers / competitors. Ordering: within each sub-sector, rank from largest to smallest (by market cap / valuation). Structure the whole thing top-down: from the full hardware-ecosystem landscape → down to each individual company. Output requirements: First, generate a structured data file ai_infra_data.json — containing all 26 companies with the fields above, the 6 sub-sector classifications, a public/private flag, and a cross-company comparison matrix (sub-sector × key dimensions). Then generate a polished HTML report from that JSON: include an ecosystem landscape / layered diagram, sector sections, company cards, a clear visual indicator for public vs. private (tags or color coding), a market-cap ranking chart, and a sortable/filterable comparison table. Make the design professional, information-dense, and interactive. Verify the research data for accuracy first (listing status, tickers, valuations — use the latest figures and cite sources), then generate the report. Send the task in single-agent mode.

Build 10 Chinese New Year HTML5 Games with Eigent

Build 10 Chinese New Year HTML5 Games with Eigent

Build 10 separate and COMPLETE games with topics related to 2026 Chinese New Year (Horse) in HTML, CSS and JS (no libraries). Games must be fun, original, polished, mobile-friendly. Include scoring, scaling difficulty, restart buttons, and smooth visuals. Cover: arcade, puzzle, endless runner, reaction, strategy, memory, 2-player local, idle, retro pixel, and 1 experimental game.

Build a 3D Snow Bros Platformer with Gemini 3.1 Pro

Build a 3D Snow Bros Platformer with Gemini 3.1 Pro

Create a modern 3D side-scrolling platformer inspired by Mario, combined with Snow Bros mechanics. The player can shoot snow projectiles to freeze monsters into snowballs, then kick them to chain into other enemies. Include a scoring system, lives display, scaling difficulty, and a restart function with rich 3D layered environments.

Automate everything with AI workforce on desktop
Download Eigent

Teste Eigent noch heute

Lade die Open-Source-Desktop-App herunter. Deine KI-Belegschaft, die auf deinem Rechner läuft.

Eigent herunterladen
Eigent

Erhalte die neuesten Updates, Tutorials und Releases rund um die Automatisierung von KI-Belegschaften.

ProduktEigentUmgebungenPreiseUnternehmen
EntdeckenLösungenAnwendungsfälleFähigkeitenPluginsBlogs
EntwicklerDokuGitHubCAMEL-AIOpen Source FundPartner
HerunterladenFür Open Source
UnternehmenÜber unsMarkeKarriereNutzungsbedingungenDatenschutzerklärungSicherheit & VertrauenCookie-RichtlinieRückerstattungs- & Testrichtlinie

Alle Rechte vorbehalten © 2026 EIGENT UK LTD

Eigent 1.0 Neue Version veröffentlicht !download