Your Morning Market Brief, Fully Automated
Every trading day starts the same way: check the indices, scan sector performance, review key indicators, update your spreadsheet, and pull together a summary for the team. By the time you've finished the routine, the market is already moving and you've burned through the first hour of your day on data wrangling instead of decision-making.
This use case eliminates that overhead entirely. You set up a recurring trigger in Eigent—an open source cowork that runs multi-step desktop work for you—that fires every morning at 9:45 AM. It gathers the latest U.S. stock market data, updates your tracking spreadsheet, and generates a polished PowerPoint report, all before you've finished your coffee. Here's how it works with SambaNova's Minimax M2.5, the Excel skill, and the PowerPoint skill.
Set Up SambaNova Minimax M2.5 as Your Model
This workflow uses SambaNova's Minimax M2.5 for market data gathering, analysis, and report generation. Head to Settings → Agents → Model, select SambaNova as your provider, and choose Minimax M2.5 as your active model. Minimax M2.5's strong reasoning and structured output capabilities make it well-suited for financial data analysis and report generation.
Built-in Excel and PowerPoint Skills
Eigent comes with built-in Excel and PowerPoint skills out of the box. They're enabled by default, no installation or configuration needed. The Excel skill lets Eigent read, write, and update Excel spreadsheets: opening workbooks, updating cells, adding rows, applying formatting, and saving changes. The PowerPoint skill gives Eigent the ability to create and modify presentations: adding slides, charts, tables, layouts, text, and images, then exporting the final deck.
With both skills enabled, Eigent can handle the full data-to-deliverable pipeline: structured data goes into the spreadsheet, and a polished report comes out as a presentation.
Set Up a Recurring Trigger
This is where the automation comes in. Instead of manually kicking off the workflow each morning, we use Eigent's trigger feature to run it on a schedule.
Go to Triggers, create a new trigger, and set it to Recurring with a schedule of everyday at 9:45 AM. Paste in the prompt:
Gather information from Bloomberg / FactSet, analyzes the U.S. stock market performance, updates key indicators in an Excel sheet, and then generates a PowerPoint report summarizing the latest market trends and insights.
Once saved, the trigger fires every weekday morning at 9:45 AM, giving you a fresh, comprehensive market brief right when you need it.
Market Data Gathering and Analysis
When the trigger fires, Eigent uses Minimax M2.5 to gather the latest U.S. stock market data from Bloomberg, FactSet, and Fidelity. It's a structured investigation that covers:
- Major indices: S&P 500, DJIA, Nasdaq Composite, and NYSE Composite: closing prices, daily changes, percentage moves, and 1-year returns
- Valuation metrics: Forward P/E ratio sourced from FactSet Earnings Insight
- Sector breakdown: Market capitalization weights and performance rankings (YTD and daily) across all 11 GICS sectors
- Key economic data: CPI, jobless claims, housing starts, trade balance, and other macro indicators
- Market-moving events: Geopolitical risks, Fed policy expectations, tariff developments, and earnings guidance trends
Minimax M2.5 synthesizes all of this into a coherent market narrative, identifying what moved, why it moved, and what it means for the trading day ahead.
Update the Excel Tracker
With the analysis complete, Eigent calls the Excel skill to create and update Market_Analysis.xlsx. The spreadsheet captures index performance, sector breakdowns by market cap and weight, YTD and daily sector rankings, key economic data, and a summary of notable market events.
Over time, this spreadsheet becomes your running record of market performance: a clean, structured dataset that's always up to date without any manual data entry.
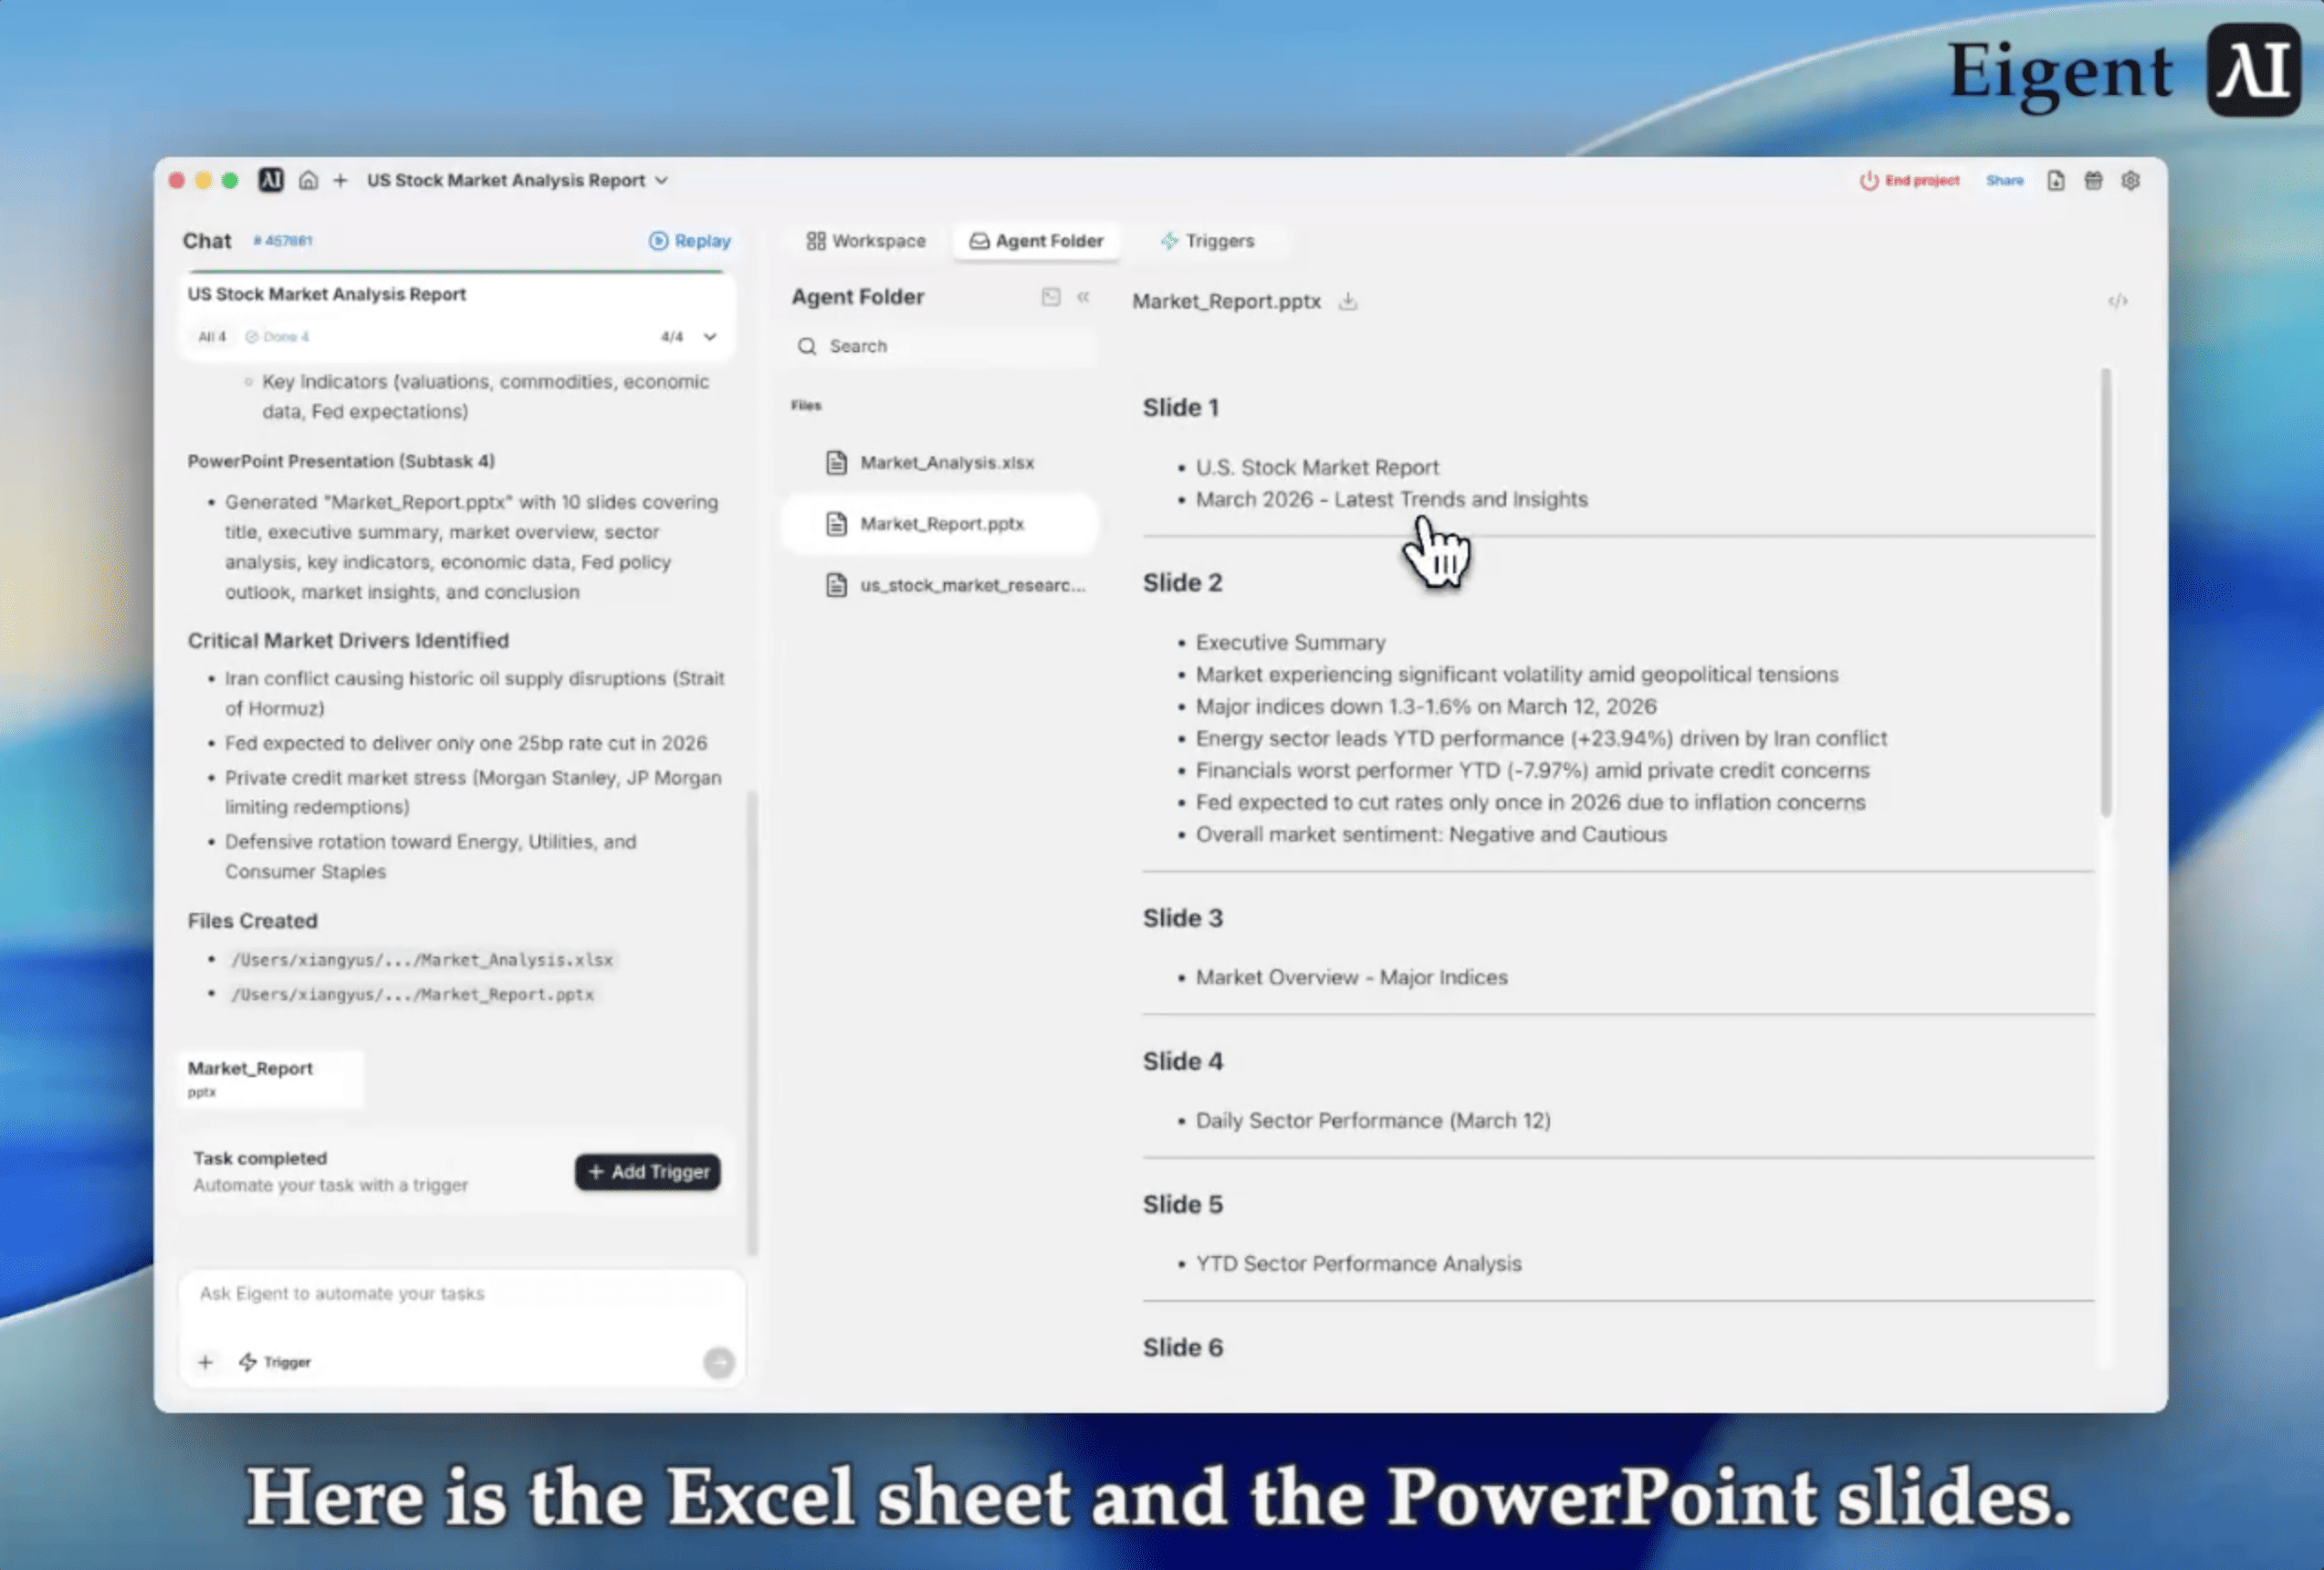
Generate the PowerPoint Report
Finally, Eigent calls the PowerPoint skill to generate Market_Report.pptx, a polished presentation summarizing the full analysis. The deck includes:
- Title slide with the date and a high-level market snapshot
- Index performance summary with a comparison table across major indices
- Sector breakdown covering market cap weights and performance rankings
- Key economic indicators with the latest macro data points
- Market-moving events summarizing geopolitical risks, policy developments, and earnings trends
The presentation is saved and ready to share with your team or drop into a morning standup.
Why This Matters
This workflow showcases what a cowork setup looks like in practice: SambaNova's Minimax M2.5 for intelligent data gathering and analysis, two specialized skills (Excel and PowerPoint) for structured output, and a recurring trigger for hands-free automation—inside Eigent, an open source cowork you can run on your own machine and extend with skills.
The key insight: skills turn desktop applications into agent-accessible tools, and recurring triggers turn one-off tasks into automated routines. Your Excel spreadsheet becomes a living database that the agent maintains. Your PowerPoint decks become auto-generated deliverables. And the recurring trigger ensures it all happens on schedule, every single trading day, with no manual intervention required.
For finance professionals, this means spending less time on data collection and formatting, and more time on the analysis and decisions that actually matter.
What to Try Next
Once you have the daily brief running, try extending the workflow:
Flag days with major economic data releases and add a note to the Excel sheet.
Add a third slide summarizing pre-market futures and overnight international market moves.
Send the generated PowerPoint to a Slack channel automatically after it's created.
Build a weekly rollup that aggregates the five daily Excel sheets into a summary workbook.
Each of these builds on the same recurring trigger and skills — no additional setup required.
Tips for Better Results
-
Tune the trigger timing. 9:45 AM gives the market 15 minutes to open before the report runs, capturing early price action. Adjust to fit your team's morning routine.
-
Scope the data sources explicitly. The more specific you are about which Bloomberg or FactSet endpoints to pull from, the more consistent the output will be across days.
-
Keep the Excel structure stable. If the spreadsheet columns change between runs, downstream formulas or charts may break. Lock in a consistent schema from the start.
-
Use the PowerPoint as a template. After the first run, open the generated deck and adjust the layout to match your brand. Eigent will maintain the structure on subsequent runs.