logo
  • Środowiska
  • Dla firm
  • Cennik
TeamMar 10, 2026

Automate Internal Project Updates with Data Viz

Celine XieCeline Xie
Automate Internal Project Updates with Data Visualizations Using the Internal Comms Skill
Automate Everything with
AI Workforce on Desktop
Download Eigent

Transform your status reports from chores into data-driven insights

Every team lead knows the Monday morning dread: hunting down progress percentages, identifying blockers, and trying to make a spreadsheet look presentable for leadership. It is a recurring bottleneck that eats hours of high-value time just to report on the work instead of doing it.

I used Eigent to automate this entire process. By leveraging the internal-comms skill and a few simple prompts, I can generate a structured 3P update — Progress, Problems, Plans — complete with visual charts in seconds.

Here is how the workflow comes together.

1Prepare the communication environment

Before starting, Eigent needs the right frameworks for corporate communication. I loaded the internal-comms skill, which contains pre-defined templates for status reports, newsletters, and incident updates. This ensures the output follows professional standards without me having to specify formatting details every time.

2Describe the project state

I gave Eigent a high-level prompt describing what I needed for the update. The goal was to create a "Project Aurora" dashboard update that felt real — including specific milestones, a technical hurdle, and future plans.

Generate a mock internal project update for a product team. Include current progress, one potential issue, and the next step, with a graph and data. Save it as a document report.

3Generate structured project data

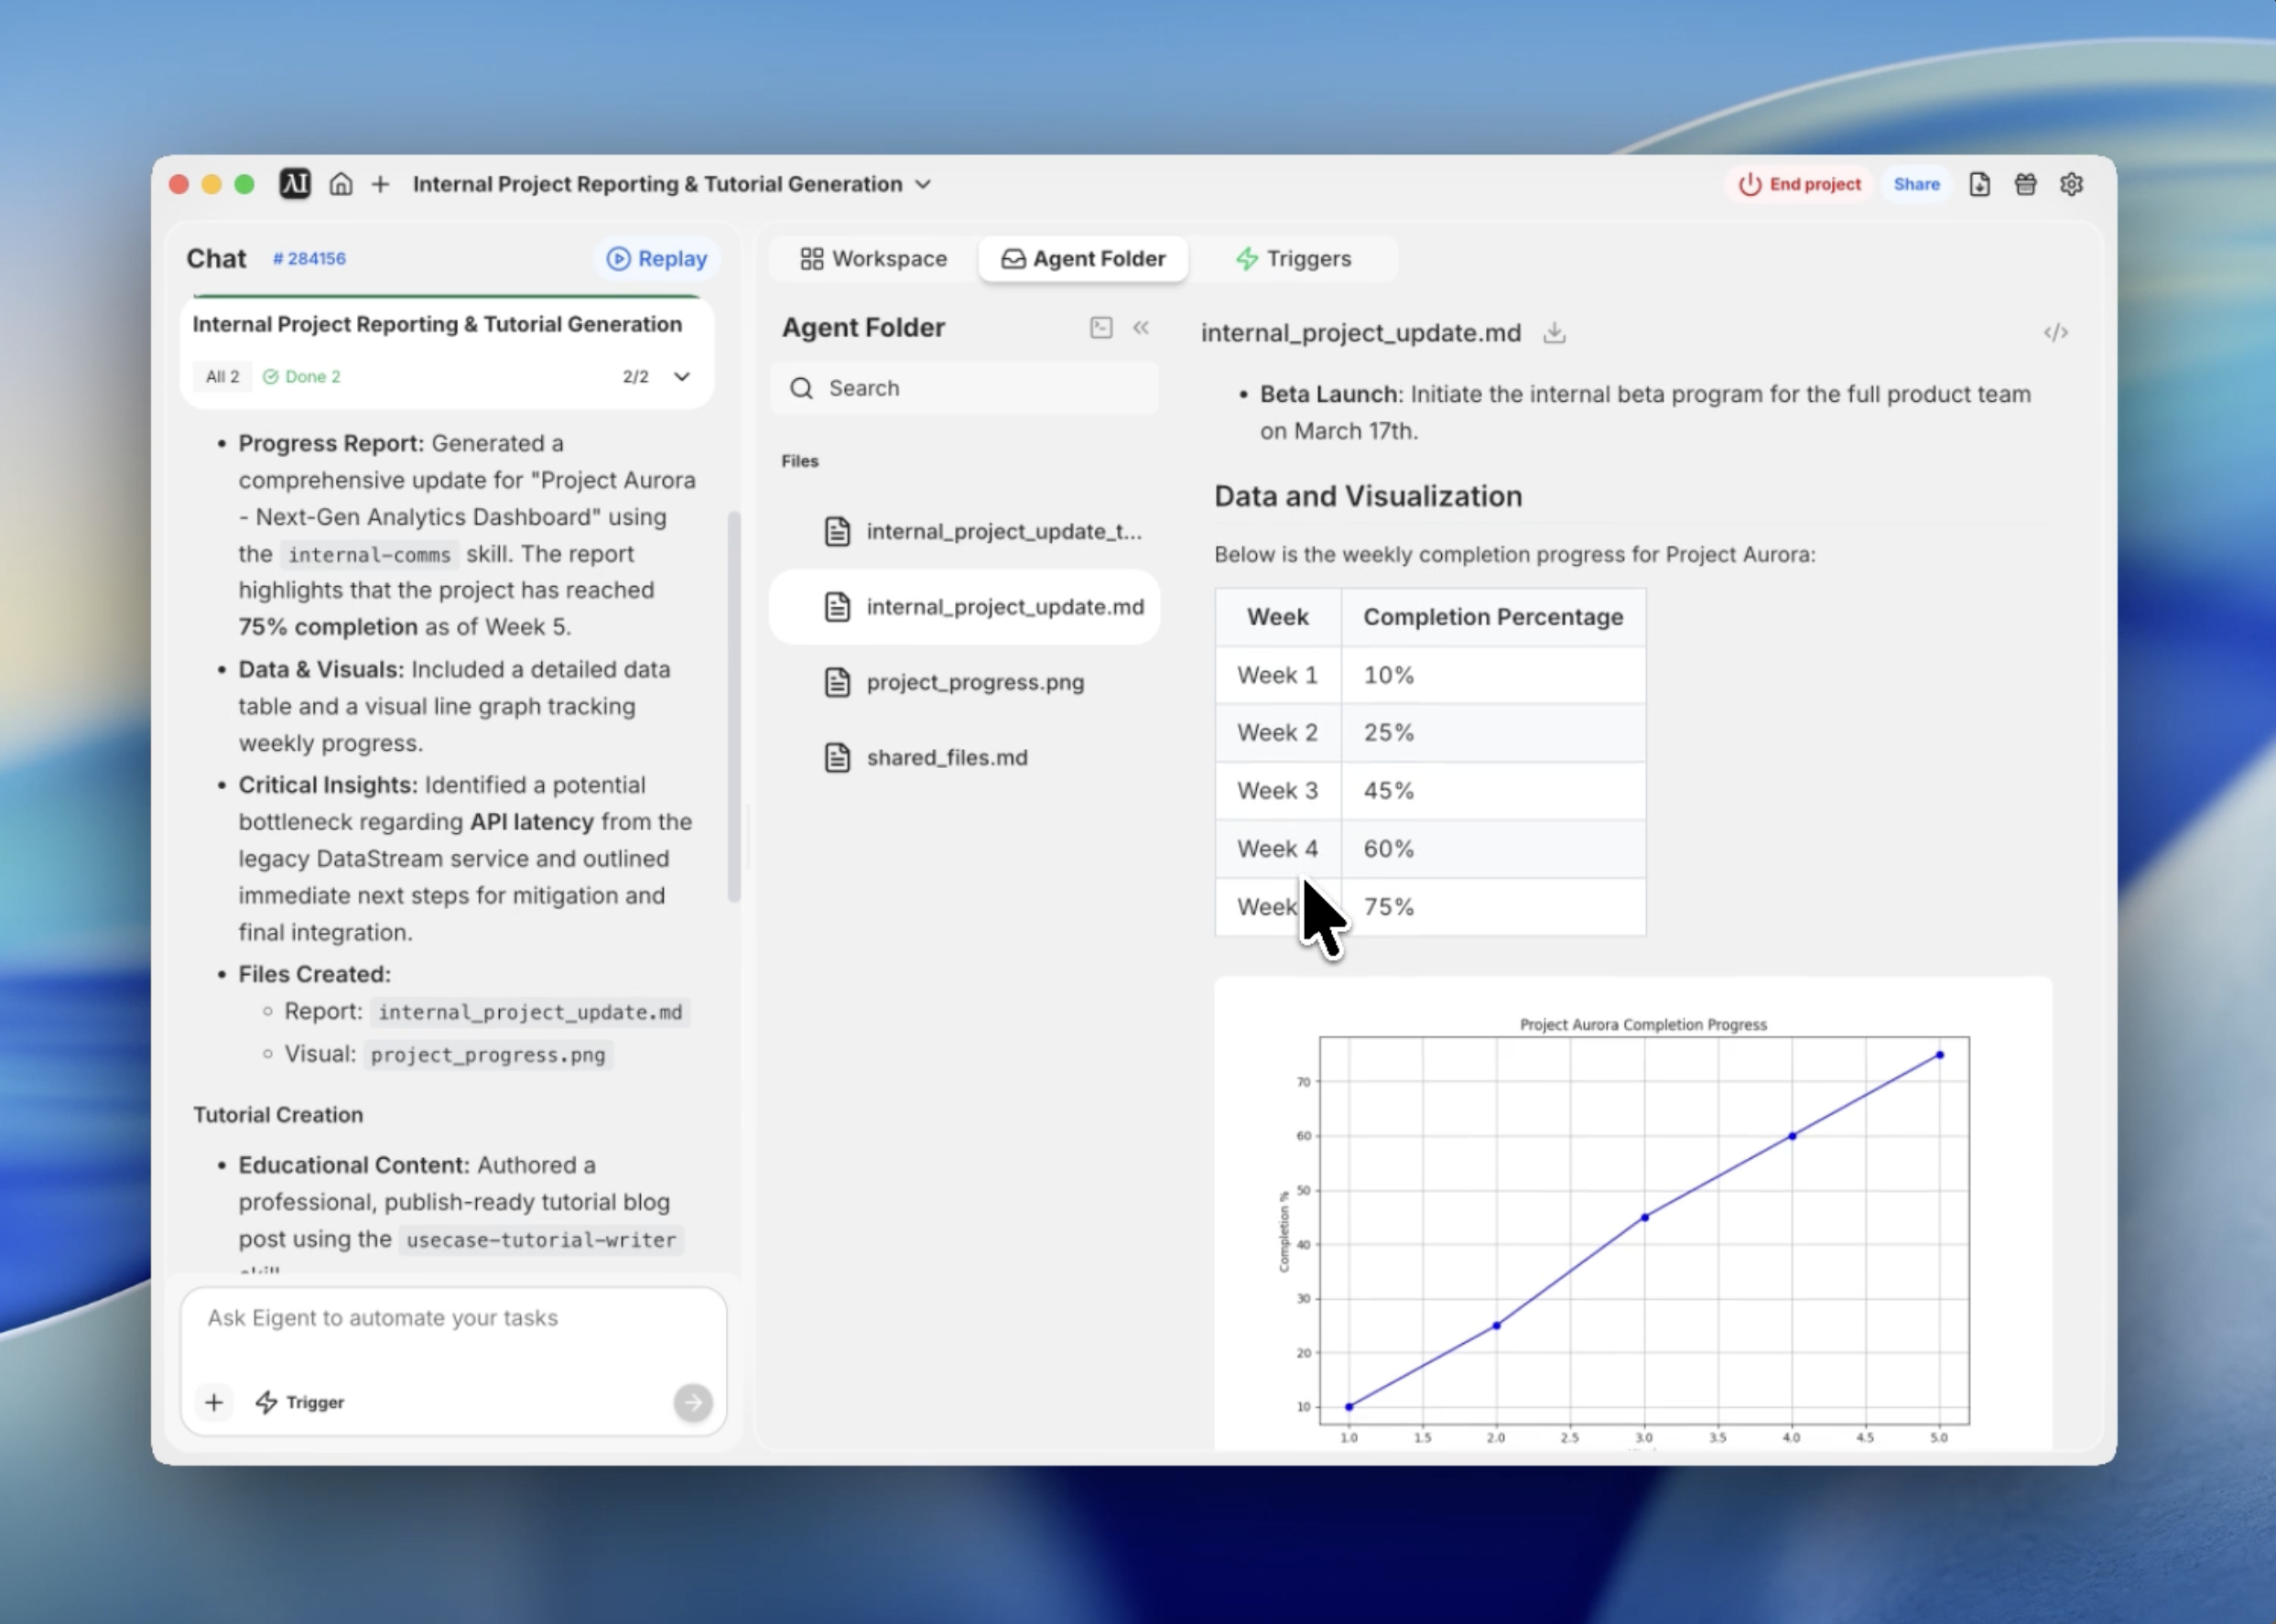
Eigent does not just write text — it structures data. It automatically generated a weekly completion table for the project, tracking progress from Week 1 to Week 5. This quantitative foundation makes the subsequent report much more credible than a simple text summary.

4Visualize progress with automated charting

To make the report "board-ready," I needed a visual. Eigent used its terminal capabilities to write and execute a Python script that generated a line graph of the progress data. The resulting image, project_progress.png, was saved directly to the project directory to be referenced in the final report.

5Draft the 3P update

Using the internal-comms guidelines, Eigent formatted the report using the 3P framework: Progress, Problems, and Plans. This structure is a industry standard for a reason — it is concise and focuses on exactly what stakeholders need to know. Eigent identified a mock "API Latency" issue and proposed a "Redis caching" solution, demonstrating its ability to handle technical context.

6Export the final Markdown report

The final step was consolidating everything into a single, clean Markdown file. Eigent linked the generated graph, formatted the data table, and organized the sections with clear headers. The result is a professional document ready for a Git repository or a team Slack channel.

Why This Matters

This workflow demonstrates the power of combining specialized skills with autonomous tool use. Eigent did not just "write a report" — it acted as a data analyst, a graphic designer, and a communications specialist in one sequence.

The true value of Eigent lies in its ability to bridge the gap between raw data and professional presentation without manual intervention.

What to Try Next

Regenerate the report but change the audience to 'Executive Leadership' with a focus on budget and ROI. Add a second graph comparing this project's progress against the 'Project Nebula' timeline. Convert the Markdown report into a 5-slide PowerPoint presentation using the pptx skill.

Each of these leverages the same internal-comms setup — no additional configuration required.

Tips for Better Results

  • Be specific about blockers. If you have a real issue, mention it in the prompt to get a more tailored "Plans" section.
  • Set the tone. Use prompts like "Keep the tone encouraging but transparent" to match your team's culture.
  • Reuse the data. You can ask Eigent to save the generated table as a CSV for use in other spreadsheets.
  • Reference existing docs. Use the "context" feature to point Eigent to your real Jira or Trello exports for 100% accurate reporting.

Other use cases

Long-Horizon Task: GLM-5.1 vs GLM-5.2 on Eigent

Long-Horizon Task: GLM-5.1 vs GLM-5.2 on Eigent

Do a deep-dive research on 26 companies in the AI infrastructure ecosystem — the most certain main thread of the entire AI value chain. Cover these 6 sub-sectors (pick representative companies in each, from large-cap leaders down to smaller players): AI Data Center (compute infrastructure / build-out); GPU / AI Chips (training & inference silicon, ASICs, IP); Servers, Networking & Optical Modules (switches, NICs, optical interconnect); Power, Liquid Cooling & Energy Storage (power supply, thermal, energy management); AI Cloud / Compute Platform (hyperscalers, GPU clouds, compute-rental platforms); Supporting Ecosystem (HBM / advanced packaging, foundry, connectors & other critical components). For each company, research: company name, sub-sector, HQ / country; core products and its specific role in the AI chain; public or private (ticker + exchange if listed; if private, note latest valuation / funding round); market cap or valuation size (used for ranking); positioning and moat in the ecosystem (1–2 sentences); key customers / competitors. Ordering: within each sub-sector, rank from largest to smallest (by market cap / valuation). Structure the whole thing top-down: from the full hardware-ecosystem landscape → down to each individual company. Output requirements: First, generate a structured data file ai_infra_data.json — containing all 26 companies with the fields above, the 6 sub-sector classifications, a public/private flag, and a cross-company comparison matrix (sub-sector × key dimensions). Then generate a polished HTML report from that JSON: include an ecosystem landscape / layered diagram, sector sections, company cards, a clear visual indicator for public vs. private (tags or color coding), a market-cap ranking chart, and a sortable/filterable comparison table. Make the design professional, information-dense, and interactive. Verify the research data for accuracy first (listing status, tickers, valuations — use the latest figures and cite sources), then generate the report. Send the task in single-agent mode.

Build 10 Chinese New Year HTML5 Games with Eigent

Build 10 Chinese New Year HTML5 Games with Eigent

Build 10 separate and COMPLETE games with topics related to 2026 Chinese New Year (Horse) in HTML, CSS and JS (no libraries). Games must be fun, original, polished, mobile-friendly. Include scoring, scaling difficulty, restart buttons, and smooth visuals. Cover: arcade, puzzle, endless runner, reaction, strategy, memory, 2-player local, idle, retro pixel, and 1 experimental game.

Build a 3D Snow Bros Platformer with Gemini 3.1 Pro

Build a 3D Snow Bros Platformer with Gemini 3.1 Pro

Create a modern 3D side-scrolling platformer inspired by Mario, combined with Snow Bros mechanics. The player can shoot snow projectiles to freeze monsters into snowballs, then kick them to chain into other enemies. Include a scoring system, lives display, scaling difficulty, and a restart function with rich 3D layered environments.

Automate everything with AI workforce on desktop
Download Eigent

Wypróbuj Eigent już dziś

Pobierz open-source’ową aplikację desktopową. Twoja SI workforce, działająca na Twoim komputerze.

Pobierz Eigent
Eigent

Otrzymuj najnowsze aktualizacje, poradniki i wydania dotyczące automatyzacji SI workforce.

ProduktEigentŚrodowiskaCennikDla firm
OdkrywajRozwiązaniaPrzypadki użyciaUmiejętnościWtyczkiBlogi
DeweloperzyDokumentacjaGitHubCAMEL-AIFundusz Open SourcePartner
PobierzDla open source
FirmaO nasBrandKarieraWarunki korzystaniaPolityka prywatnościBezpieczeństwo i zaufaniePolityka plików cookiePolityka zwrotów i wersji próbnej

Wszelkie prawa zastrzeżone © 2026 EIGENT UK LTD

Wydano nową wersję Eigent 1.0!download