

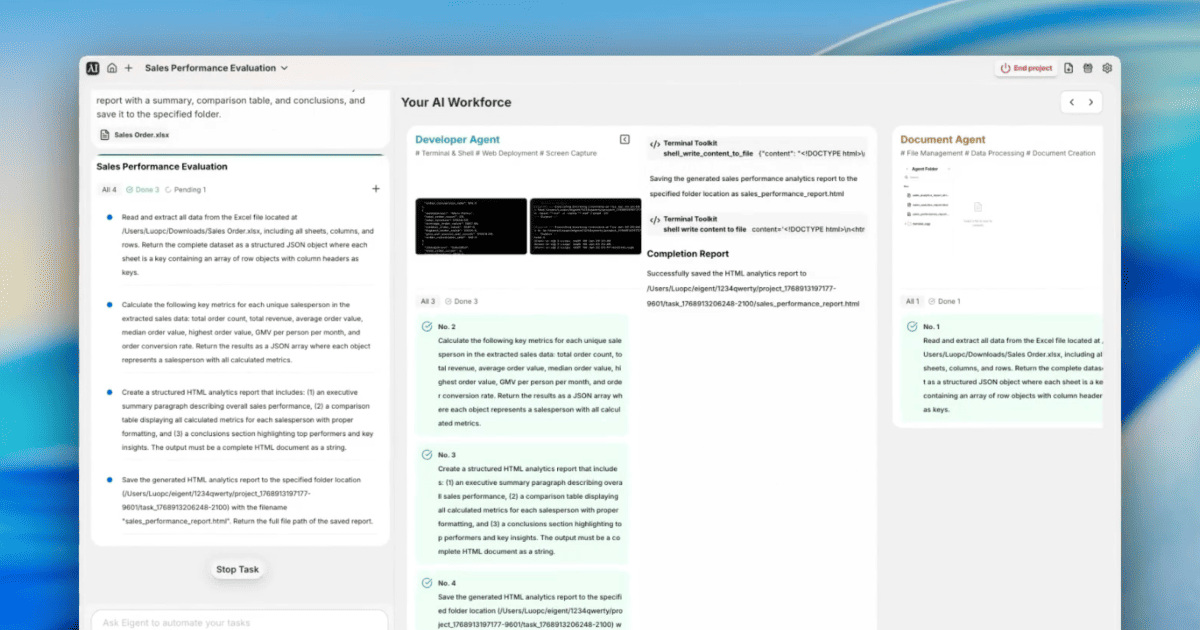
From Raw Excel Data to a Boardroom-Ready Analytics Report
Sales performance reviews start the same way every time: download the data, open Excel, write formulas, format a table, copy it into a report, add some conclusions. It takes hours. This workflow — Eigent powered by Kimi K2.5 — does all of it from a single prompt and a spreadsheet attachment, producing a complete HTML analytics report with an executive summary, comparison table, and strategic recommendations.
Configure Kimi K2.5 as Your Model
Kimi K2.5 (by Moonshot AI) is a high-capacity model well-suited for data-intensive tasks. To use it in Eigent, go to Settings → Models → Custom Models, add Kimi with these settings:
- API Host:
https://api.moonshot.ai/v1 - Model:
kimi-k2.5
Validate and set as Default. Eigent confirms function-calling support before saving.
Attach the Excel File and Write the Prompt
Attach your Sales Order.xlsx file directly to the prompt:
We are conducting a sales performance evaluation. Analyze the sales data in this system and compare all salespeople across key metrics, including order count, total revenue, average/median/highest order value, GMV per person per month, and order conversion rate. Generate a structured HTML analytics report with a summary, comparison table, and conclusions, and save it to the specified folder.
No pre-processing. No pivot tables. Just the file and the ask.
Three Agents, Three Tasks
Eigent splits the work across three sequential tasks:
Task 1 — Document Agent: Reads every row and column from Sales Order.xlsx and outputs the complete dataset as structured JSON, with each sheet as a key and rows as objects keyed by column header.
Task 2 — Developer Agent: Takes the JSON dataset and computes, per salesperson:
- Total order count
- Total revenue
- Average, median, and highest order value
- GMV per person per month
- Order conversion rate
Results returned as a JSON array.
Task 3 — Developer Agent: Takes the metrics JSON and generates a complete HTML report:
- Executive summary paragraph
- Comparison table with all salespeople and all metrics side by side
- Key insights and strategic conclusions
- Saved as
sales_performance_report.html
What the Report Reveals
The generated report surfaces insights that can take hours to uncover manually. In this example dataset, the analysis found:
- Top performer: Mitchell Admin — responsible for 89% of total team revenue, with an average order value of $15,095
- Revenue concentration: Mitchell generates 9× more revenue than the second-best performer
- 100% conversion rates across all three sales reps — every order placed was completed
- Volume vs. value split: Marc Demo leads in order count (35 orders) but has a lower average order value
- Growth opportunity: OdooBot shows a reasonable average value across a small order count, indicating untapped potential
Each insight comes with a corresponding strategic recommendation — mentorship program design, territory redistribution analysis, methodology sharing — ready to use in a performance review.
Why This Matters
Excel-to-report pipelines are one of the most common bottlenecks in sales operations. The combination of data extraction, metric calculation, and narrative generation is exactly the kind of multi-step analytical work that Eigent handles natively — without requiring the user to write any Python, configure any BI tool, or format any table manually.
Kimi K2.5 brings strong quantitative reasoning to this workflow, making it reliable across different spreadsheet structures and data volumes.
What to Try Next
Run the same analysis on last quarter's Excel file and compare it to this one — show me which reps improved.
Generate the report as a PDF and email it to the sales team.
Add a chart showing revenue by rep as a bar chart in the HTML report.
Flag any rep whose conversion rate dropped more than 10% compared to last month.
Tips for Better Results
-
Clean your column headers. The Document Agent maps rows by column header names. Consistent, descriptive headers (like "Order Value" rather than "Col_D") make the metric calculations more accurate and the report labels more readable.
-
Specify the output path. Including "save it to the specified folder" in your prompt, or naming an absolute path, ensures the report lands exactly where you need it — rather than in the agent's working directory.
-
Ask for chart-ready data. Adding "also export the metrics as a CSV alongside the HTML report" gives you a structured dataset you can drop into any BI tool for further visualization.